Enter Results
Contents
Once samples have been received, the sample’s tests will be available for results entry. Access to this step is dependent on the Lifecycle: Enter results permission on your user account.
To locate a job for results entry:
- Select the
Lifecycle > Enter Resultsmenu from the sidebar or click on the [ Enter Results ] icon in the header. - Click on a job in the left list to load the job details. Jobs will be grouped by client if you have more than one client associated with your user account.

📒 You can search for jobs by ID, batch number or client to locate particular jobs.
Samples at enter results are grouped by test method. Each grid row is a sample test and consists of the sample identifier, the sample’s batch number, the sample’s product and its inputs and outputs.
Entering Results
You can enter the results for a test by selecting a cell in any input column and entering a value. The value is automatically saved upon entry.
Inputs
- If the input is a text type, any value can be inserted into the cell.
- If the input is a numeric type, only numeric values can be entered. Up/down arrows will display when the cell is clicked.

- If the input is a list type, a selection box will appear listing all the possible values the input can use.

📒 To see more information about an input, such as the input identifier or whether it’s mandatory, hover over the input name in the column header.
Understanding the Grid
Columns
The input columns in the grid are editable. All other columns are read only.
It is possible to show and hide some columns using the three vertical lines icon located to the top left of each test method grid.

When a column is hidden it is hidden for all test method grids. The selected columns will be remembered for the current user and browser.
📒 Inputs with a Display on value set to anything other than 'Workbook' will be available here for entering results. For more details on workbook-only inputs, see Test Methods.
Navigation
Upon selecting an input cell, the cell will transition to "edit mode" allowing a value to be inserted. You can click out of the cell again to transition the input cell back to "read only" mode.
A number of keyboard shortcuts exist to make traversing and entering results easier. See below for a list of shortcuts:
- Up/right/down/left arrow keys: Navigates the highlighted cell in the grid in the direction of the arrow key pressed.
- This behavior works in both edit and highlighted cell status.
- Enter key: Navigates to the cell below the current highlighted one.
- Where the input is a list the enter key will open the list allowing you to select the required option (using your keyboard arrow keys)
- Once the required list option is highlighted pressing enter will select that item and navigate you to the input below.
- Escape key: Enters read only mode if any cell is in edit mode.
- Tab key: Navigate one cell to the right.
- Tabbing will navigate through all inputs and outputs on the row and then move onto the first cell on the next row.
📒 It is also possible to enter edit mode of an input by typing the result when the cell is highlighted.
You can hide columns by clicking the three horizontal lines icon in the top left of the grid. Input and output columns cannot be hidden.
Outputs
Output columns are located at the end of the grid. The column header consists of the output name and the output units.
Calculating Outputs
Once all inputs for an output have had a value entered, the output will calculate using the result calculation defined on the test method output.
📒 To see more information about the output, such as the result calculation used, hover over the column header.
If an output has failed to calculate, the value (?? ) will be displayed in the output cell. It is still possible to submit tests with failed outputs.
Once all outputs for a test have been calculated, the row will be ready for submission.
Record Stock Usage
⭐ This is a premium feature. Please click here for more information.
Stock used in testing can be recorded during results entry. Click the [Record Stock] icon next to the product to record stock used for the selected test.

A dialog opens, showing each stock item required for a typical test and the expected usage. If no stock appears in the dialog, ensure it has been setup against the relative test method.

The 'Quantity required' badge indicates the typical amount needed to fulfil the test. Click the 'Select Stock Batch' dropdown list to view all available stock batches and available quantities.

Select a stock batch and enter a quantity to consume. Click the [Add] button to add it as pending stock usage.

The [Select Stock Batch] dropdown list displays all stock, but only stock with remaining quantity can be selected. The panel below the dropdown list shows the pending batches marked for consumption.

Clicking the [Save] button will confirm any pending usage, reducing the stock batch quantities. Use the cross icon at the end of the row to remove these if they are no longer required. Saving after using the cross icon will replenish the stock batch quantities, making these available for use in other tests. The 'Current Usage' progress bar indicates the progress made towards recording the required amount. Pending stock usage can be saved at any point, up to the 'Quantity required' amount.

Stock consumption recorded through enter results will be stored as type 'Testing' on the usage tracking screen.

The [View test] link can be used to view the test the usage has been recorded against.

Results Submission
Once a row is ready for submission, a checkbox will appear in the row, and it will be marked for submission. The test can be unselected to be submitted at a later time.
The submit button will outline in brackets the amount of tests that are selected for submission.
If the test has an associated specification, the submit button will display as [ Show Summary and Submit ], otherwise the button will display as [ Submit ].

Once all tests have been submitted for a test method, a green Submitted label will appear in the top right.

Test Summary
Upon submitting tests with specifications, a test summary panel will display prior to the tests being submitted. This is so you can review your test results prior to submission.
Any results that are out of specification or warning limits will be displayed in the summary in a readable format.
Only the tests being submitted will be taken into account in the test summary pane.

Once you are happy with your results, the [ Submit ] button at the bottom of the test summary screen will submit the tests.
Specifications
Outputs that are found to be out of specification or outside of the set warning limits will be highlighted red or yellow respectively and an icon will appear next to the relevant output cell.

Viewing Specification Limits
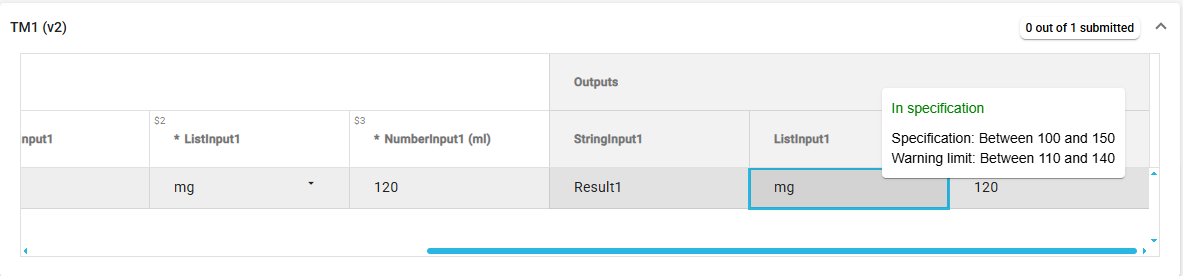
You can view specification limits of any output that has a result by hovering over the cell. A popup will appear displaying a quick summary (pass / fail / out of specification) as well as specification limits, warning limits and the output description.
You can also view specification limits on the test summary screen by hovering over rows on any failed or out of warning limit tests.
For tests with single-value numeric results, you'll see a graphical representation of the specification limits using a sparkline displayed in the specifications tool tip when hovering over the test output at Enter Results and Verify Tests. This gives users a quick visual understanding of where the the result sits relative to the acceptable numeric range.
Specifications for 2D Coordinates
For tests that produce 2D coordinate results (e.g. x,y measurements), the system can automatically compare the result against a configured coordinate specification. Coordinate specifications define an allowable area on a graph. The system then evaluates the coordinate result to determine whether it falls within, on or outside the defined specification area.
Specification Comparison
Specification comparison for coordinates occurs when:
- A result is entered for a test of type: 2D coordinate, and
- A coordinate specification has been configured for the product
Pass/Fail Rules
Coordinate results are assessed as follows:
- Pass
- The coordinate result lies within the specification area, or
- The coordinate result lies on the boundary of the specification area
- Fail
- The coordinate result falls outside the defined specification area
Graphical Display of Specification Areas
To help users understand the comparison visually, the specification area is displayed as a graph in the specifications tool tip when hovering over a test output at Enter Results and Verify Tests. The specification area is visually outlined on the graph and coordinate limit boundaries are displayed. The result also appears on the graph for direct comparison.
When submitting results, if any coordinate results are out of specification, the specification area graph will also be shown in the submission summary with the failing point.

Editing Results
Jobs with a status of Results Submitted will still be available for selection at Enter Results.
If any test inputs require modification after the test has been submitted, it is possible to reopen the job in Enter results and modify the test result.
📒It is not possible to edit results of a test if the test has a status of Results Verified . The test will still be visible at Enter Results for clarity, but the input cell will not be editable. For more information on reverting verification, see here.